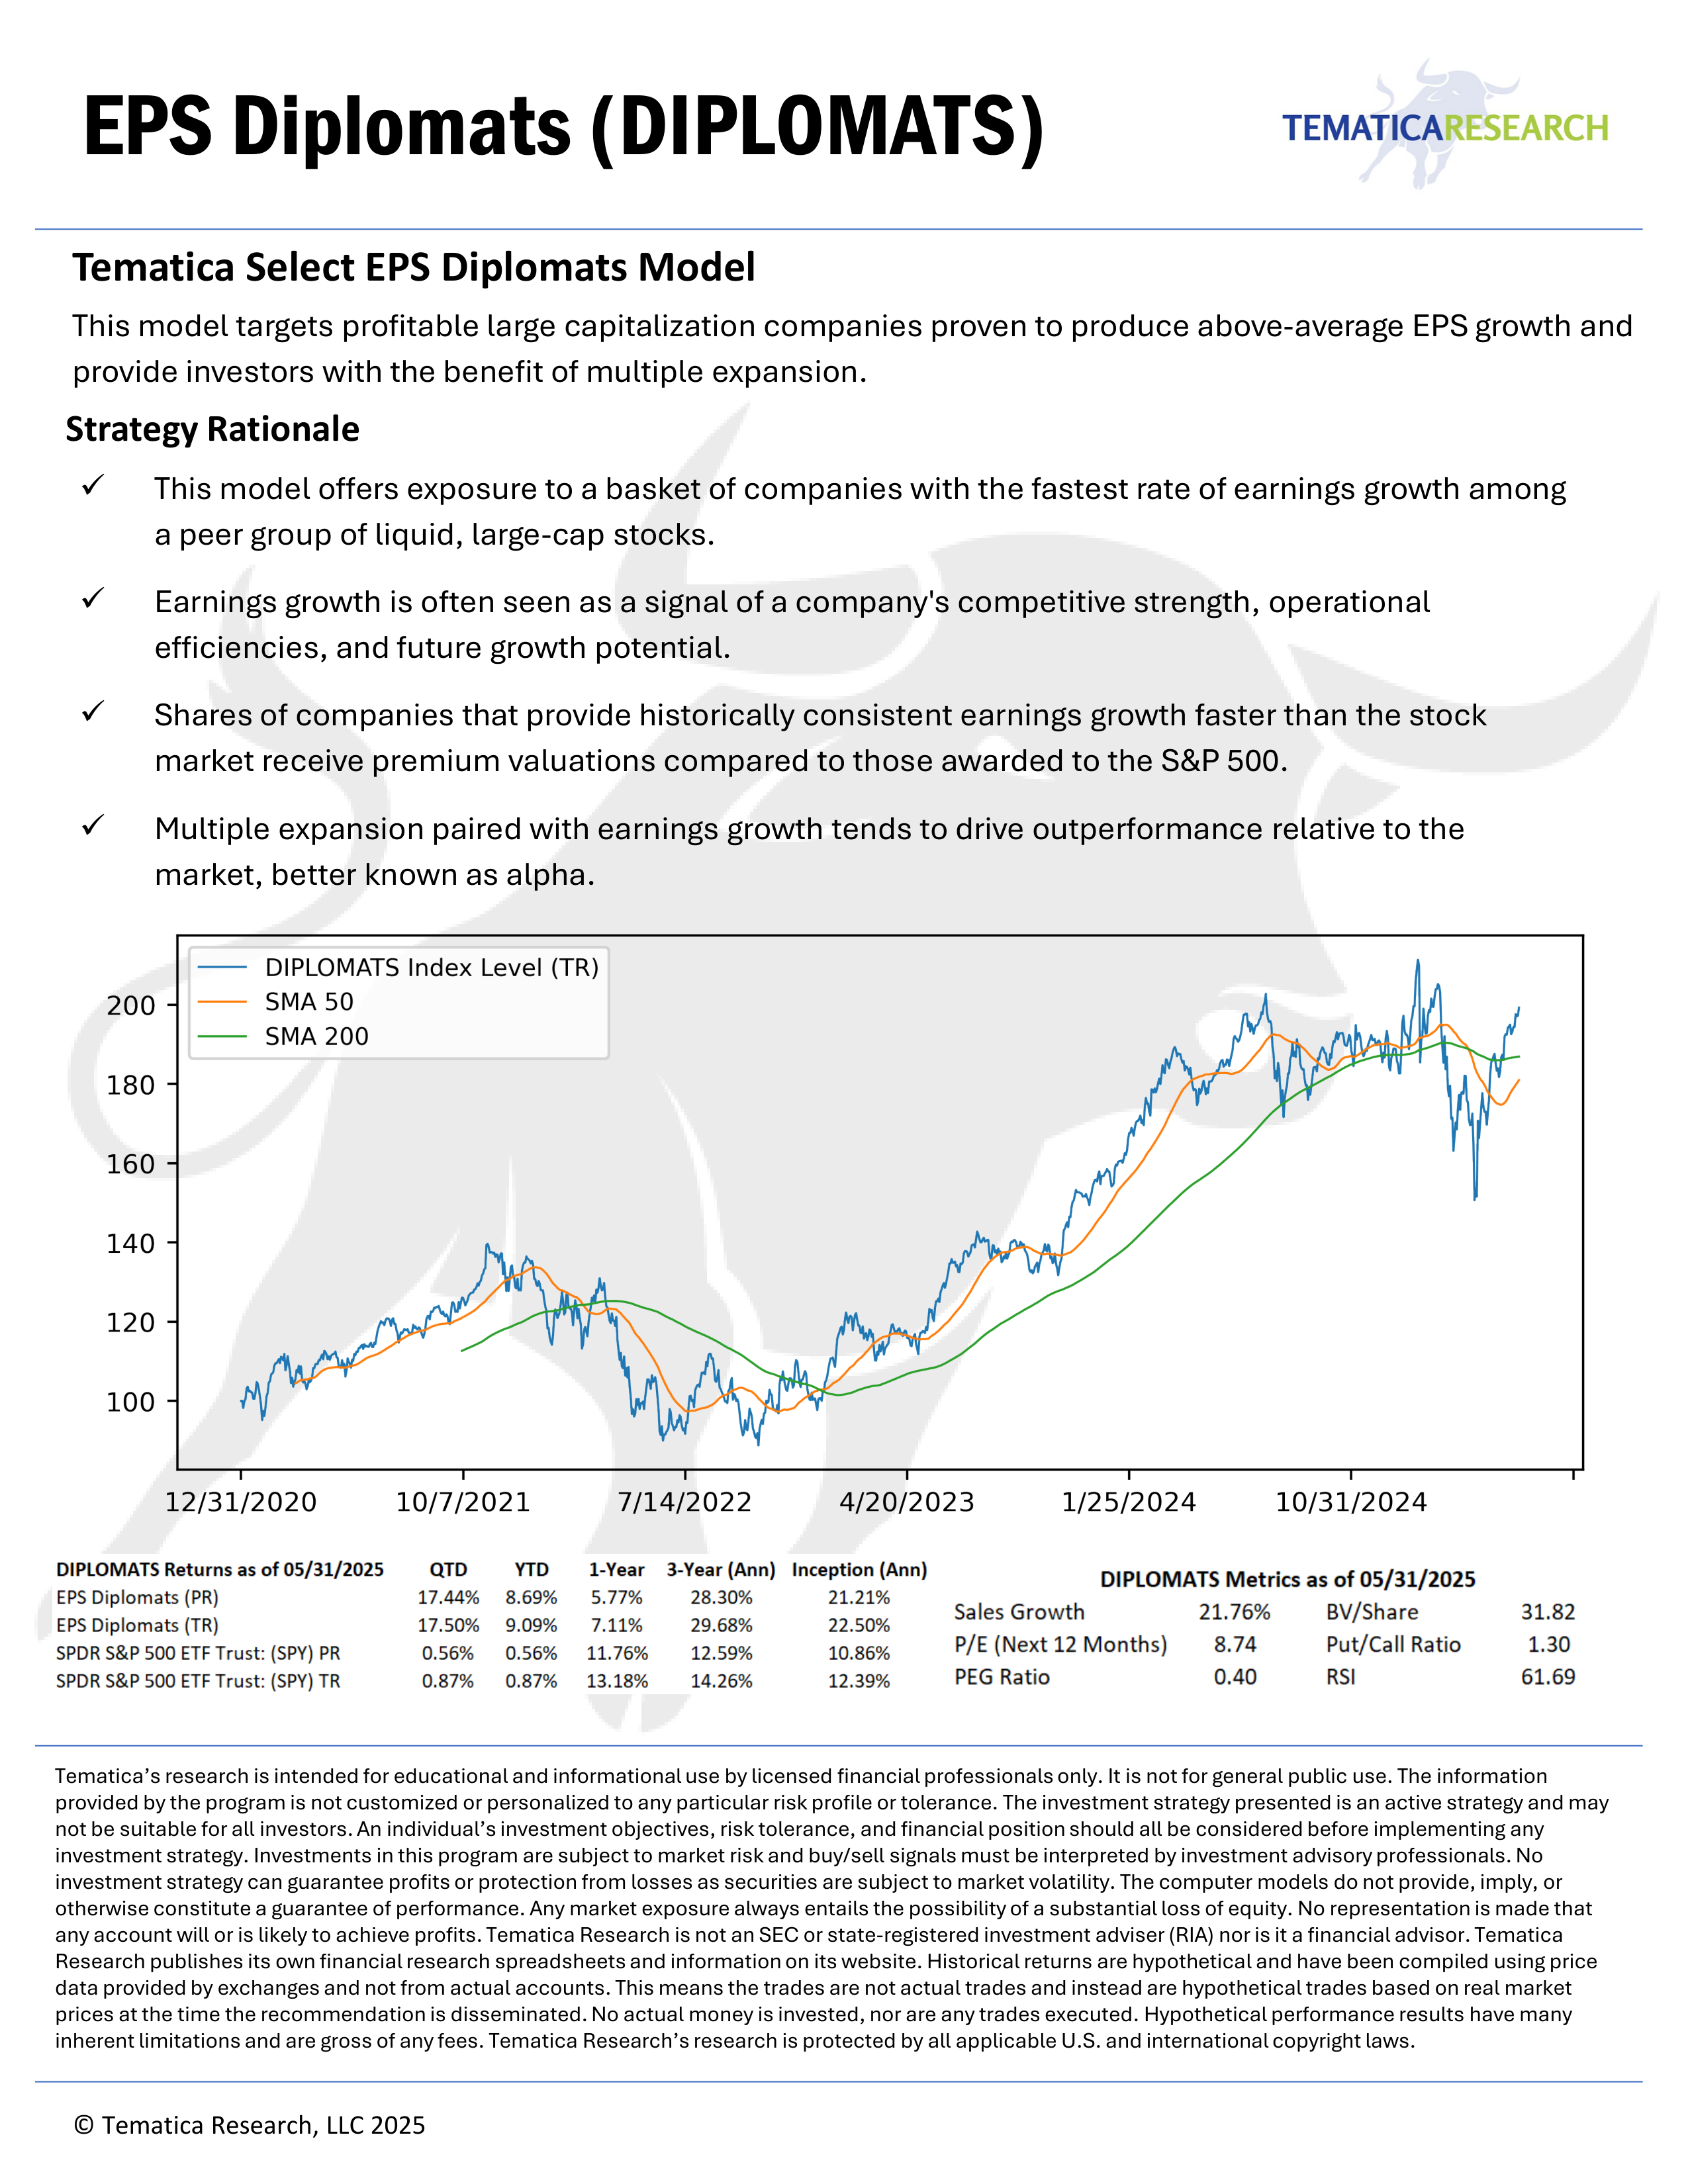
 Tematica Select EPS Diplomats Model
Provider: Tematica
| Annualised Return | 26.48% |
| Realised Volatility | 24.27% |
| Downside Volatility | 15.36% |
| Max Drawdown | -32.11% |
| Winning months | 63.33% |
| Sharpe Ratio | 1.09 |
| Sortino Ratio | 1.72 |
| Calmar Ratio | 0.82 |
| Viking Ratio | 0.35 |
Monthly performance
| Jan | Feb | Mar | Apr | May | Jun | Jul | Aug | Sep | Oct | Nov | Dec | YTD | |
|---|---|---|---|---|---|---|---|---|---|---|---|---|---|
| 2025 | 7.69% | -4% | -9.43% | 11.57% | 6.04% | 8.05% | 0.56% | 4.38% | 17.26% | -3.19% | 17% | 7.86% | 80.02% |
| 2024 | 5.51% | 6.88% | 4.74% | -4.5% | 3.59% | 4.26% | -4.53% | -0.89% | 2.15% | 0.22% | 1.57% | -4.77% | 14.14% |
| 2023 | 15.91% | -0.58% | 1.95% | -2.45% | 7.3% | 9.37% | 2.44% | -0.4% | -4.21% | 0.66% | 11.47% | 4.06% | 53.48% |
| 2022 | -10.22% | 2.36% | 3.47% | -18.01% | -1.38% | -11.48% | 11.96% | -2.19% | -8.92% | 9.81% | 7.35% | -7.71% | -26.14% |
| 2021 | -3.64% | 12.59% | -2.67% | 4.68% | 2.1% | 4.93% | -1.57% | 4.48% | -0.19% | 6.21% | 0.91% | 2.8% | 33.92% |