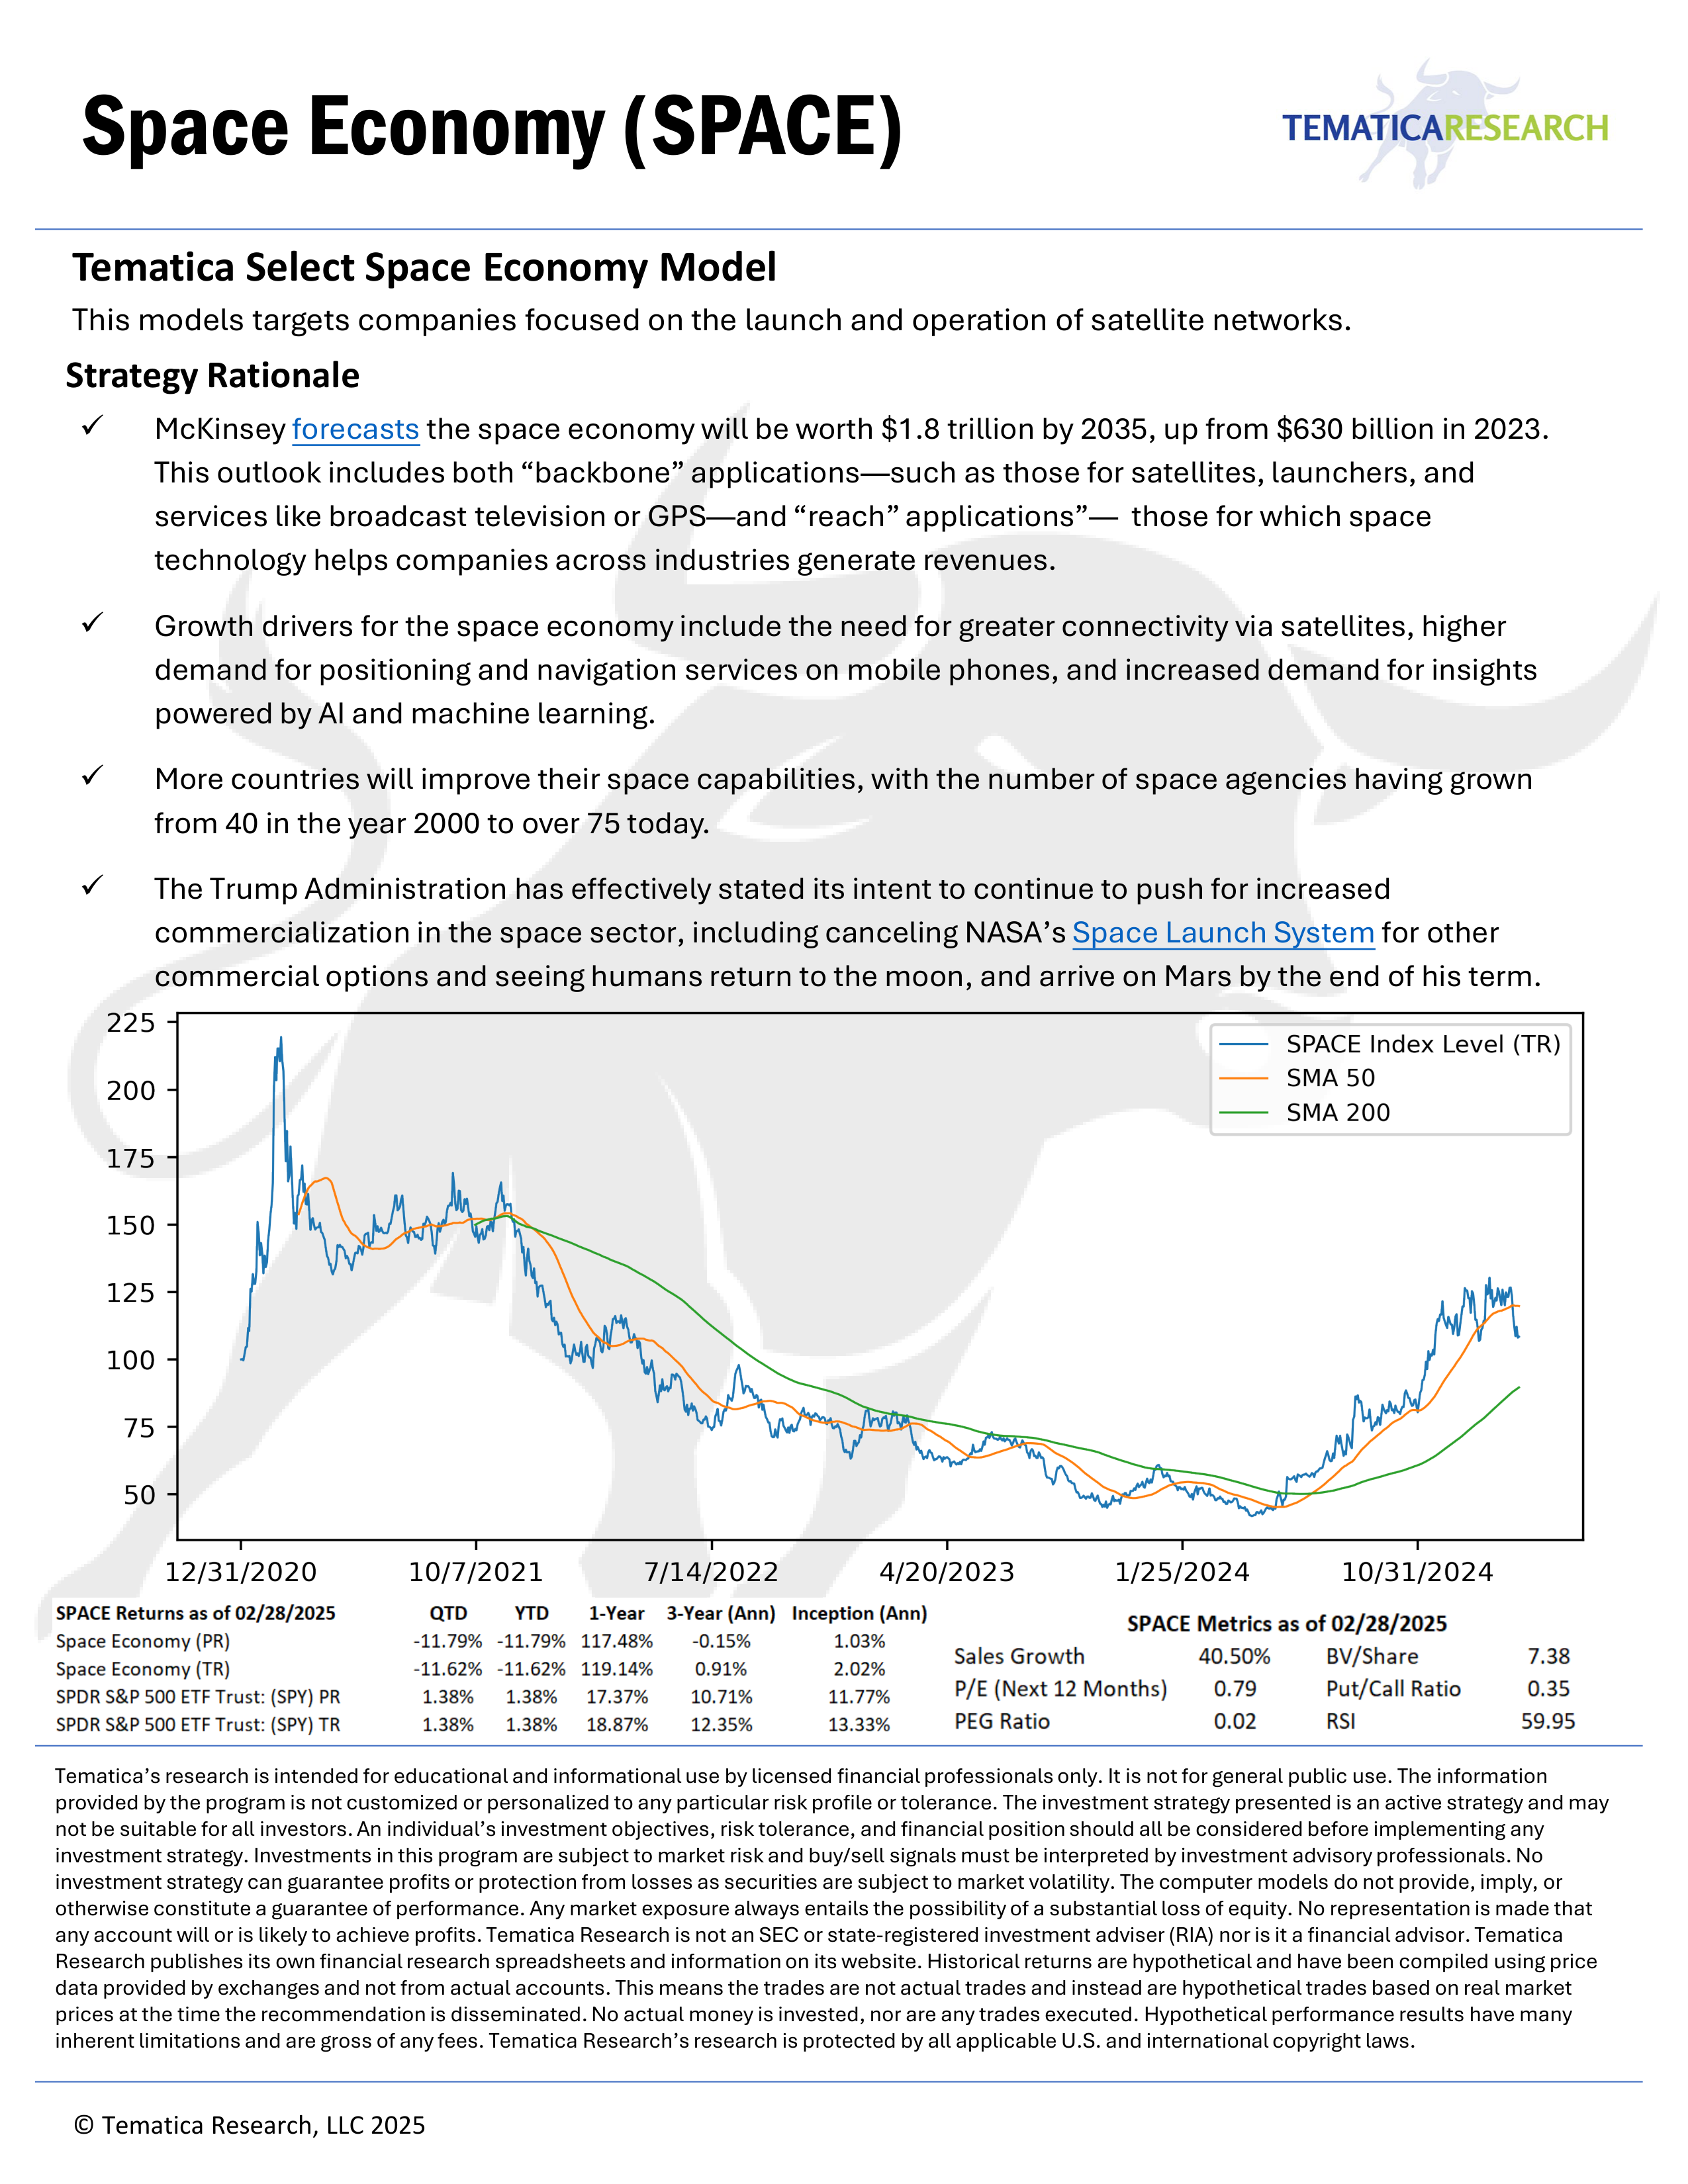
 Tematica Select Space Economy Model
Provider: Tematica
| Annualised Return | 7.98% |
| Realised Volatility | 50.41% |
| Downside Volatility | 23.81% |
| Max Drawdown | -76.52% |
| Winning months | 57.38% |
| Sharpe Ratio | 0.16 |
| Sortino Ratio | 0.34 |
| Calmar Ratio | 0.1 |
| Viking Ratio | 0 |
Monthly performance
| Jan | Feb | Mar | Apr | May | Jun | Jul | Aug | Sep | Oct | Nov | Dec | YTD | |
|---|---|---|---|---|---|---|---|---|---|---|---|---|---|
| 2026 | 19.83% | 19.83% | |||||||||||
| 2025 | 1.81% | -11.78% | -25.21% | 4.21% | 12.33% | 36.85% | 4.26% | 6.72% | -0.33% | 14.61% | -9.67% | 22.37% | 51.18% |
| 2024 | -15.71% | -1.45% | -2.79% | -12.55% | 28.41% | 3.6% | 22.75% | 11.33% | 7.46% | -3.58% | 42.52% | 1.75% | 92.89% |
| 2023 | 7.77% | 5.63% | -19.29% | -5.14% | 6.23% | 6.99% | -5.49% | -10.84% | -18.38% | -5.92% | 11.03% | 15.02% | -18.15% |
| 2022 | -14.98% | 5.22% | 4.03% | -16.13% | 0.32% | -19.56% | 6.32% | 9.41% | -21.98% | 13.68% | -4.32% | -9.81% | -43.93% |
| 2021 | 32.19% | 27.14% | -10.56% | -4.78% | 3.44% | 5.82% | -6.45% | 3.88% | 3.27% | 0.41% | -6.11% | -17.83% | 21.79% |